Cracking the Code of Trendline Trading: Strategies for Consistent Profits
Trendlines are incredibly important when it comes to successful trading, but you'd be surprised to learn that many traders actually use them incorrectly.
In this article, we're going to guide you through everything you need to know about trading with trendlines, from start to finish.
First do a quick recap of the Trendline Basics to get all the new people here on the same page.
How do we trade with trendlines?
There are two main approaches:- When the price finds support or resistance at the trendline, it's an opportunity to enter a trade.
- When the price breaks through the trendline, it can also be a signal to enter a trade.
Trendline As Support or Resistance
Now let's talk about how trendlines can act as support or resistance. When a trendline has been identified and is acting as support or resistance, you can use it as a reference for entering the market once the price returns to it.
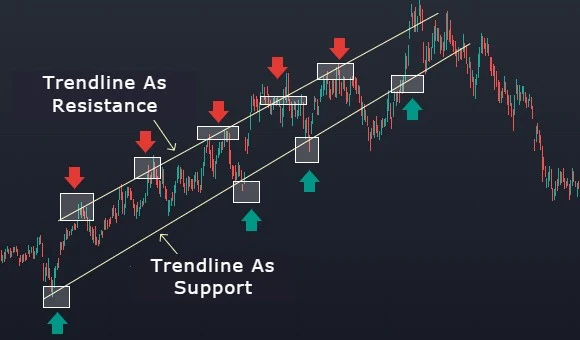
In the example above, you can see two different trendlines acting as support and resistance. The rectangular zone at the support line indicates a potential opportunity to go long, while the rectangular zone at resistance suggests a potential opportunity to go short.
For a long setup, you can enter a trade after the price finds support at the trendline, with a stop loss placed below the trendline. Conversely, for a short setup, you can enter a trade after the price finds resistance at the trendline, with a stop loss placed above the trendline. The size of the stop loss depends on your specific strategy.
Long Setup- Long entry after the price finds support at the trendline.
- Stop loss below the trendline.
- Short entry after the price finds resistance at the trendline.
- Stop loss above the trendline.
A stop loss order can be placed on the opposite side of the trendline. The size of the stop loss is determined by the strategy.
Remember, the significance of a trendline increases with the number of times the price has touched it in the past.
What causes trendlines to break?
Now, let's discuss what causes trendlines to break. On a price chart, trendlines typically connect a series of highs or lows. It's important to understand that trendlines aren't set in stone; they can break due to various factors such as news events, opposing trendlines, or support and resistance levels.
When a trendline is broken, it is no longer valid as support or resistance, and the price is likely to continue in the opposite direction. As a trader, it becomes your responsibility to identify short or long opportunities when a trendline break occurs.
Trendline Trading Setups
There are two types of setups to consider when trading trendlines: trendline immediate breakout setups and trendline retracement setups.
When a trendline is broken, it is no longer valid as support or resistance, and the price is likely to continue in the other direction. When a trendline is broken, it is your job as a trader to hunt for a short or long opportunity.
In this section, we'll go over both setups and provide an example of each. So let's get started.
SETUP 1:
The above figure represent the immediate breakout sell and buy setups. You may place sell or buy order respectively right after breakout occurs.
SETUP 2:
The above figure represent the retracememnt sell and buy setups. You may place sell or buy order respectively right after the price retest the trendline.
Let's put these concepts into action on real-world trading charts and see how well they function in reality.
Immediate Breakout: Sell setup
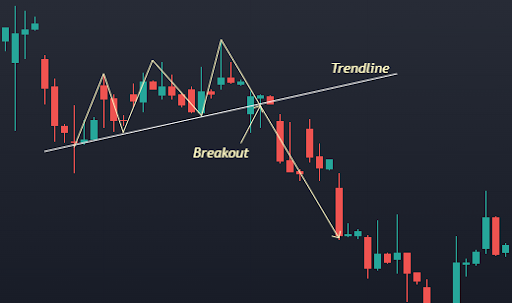
This is a straightforward trendline breakout setup with no complications. When the upward trendline intersects the downward trendline in this setup, there is little to no hesitation in the downward movement. The market just pulls away from the crossed trendline fast.
Immediate Breakout: Buy Setup

This is a pretty simple and straightforward setup. Once the downward trendline is broken, there is no hesitation in moving upward.
Retracement Setup: Sell Setup

This arrangement is a little challenging. When the upward trendline is broken in this scenario, price drops, waits, and then moves back up to test the just broken trendline before falling. You may call it the pullback or retracement setup after a trendline break
Retracement Setup: Buy Setup

This is a pullback setup, after the downward trendline has been intersected. Price rises briefly, then pauses and falls back down to find support on the trendline that has just been intersected, before eventually rising again.
Don't worry if these setups seem simple or if you're struggling to understand them fully. We'll provide plenty of complete charts later in this lesson to help you apply what you've learned in real-world trading situations.
The longer the market remains flat, the greater the outbreak, because when the market decides on the next direction, a new trend starts, and many traders follow this trend.