Day trading strategy- Bull Flag Pattern
In day trading, the Bull Flag pattern is a fast execution trading strategy that works best on stocks with low float. Backtesting clearly shows it quite often on the chart when the stock is in a strong uptrend.
The bull Flag pattern is one of the favorite patterns for a day trader. The hard part is recognizing the pattern in a timely manner.
Let's catch a glimpse of Bull Flag Pattern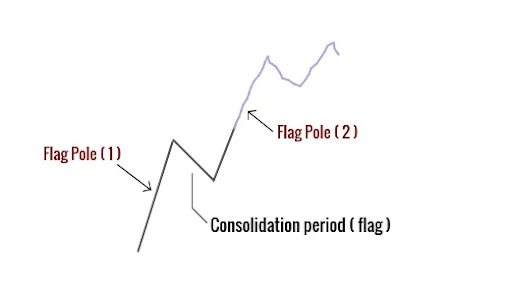
Don't worry, there will be plenty of detailed charts later when we talk about how to use what we've learned in real-world trading.
As a day trader, treat Bull Flag as a scalping strategy because these flags won't last long on a smaller time frame. So the plan is - Get in quickly, take your profit, and close the position (take leave for the day, don't overtrade).
Characteristics of a Bull Flag
- An uptrend (Bullish market).
- The consolidation phase.
- Breakout.
- The volume pattern.
- Continuation of price in the preceding flagpole direction as the breakout.
Now, you may probably think, this flag pattern (consolidation phase) isn't just a pullback. Of course, it is a pullback but the flag pattern pullback is slightly different from a normal pullback.
The Flag pattern pullback consists of only a few smaller range candles with no more than 50% retracement of the flagpole.
Hence, if you spot a steep pullback with a large range candle, then this is not a Bull Flag pattern (avoid trading).
Have a look at the below figure for a better understanding -
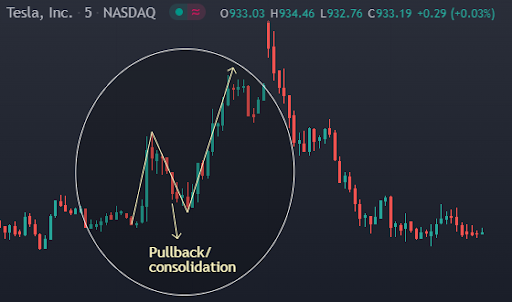
The above chart is not a Bull Flag pattern because the pullback retracement is more than 50% of the flagpole and also it's containing the larger range candles during the consolidation/ pullback phase.
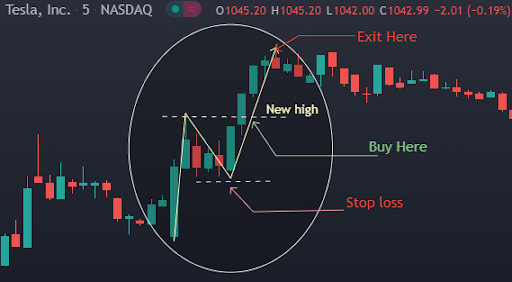
Trading Checklist
- Draw S/R
- Check the trading volume at the breakout
- Entry-Exit point
- Stoploss
- Position Sizing
- Your risk profile
- S/R: Support and Resistance (S/R) are the points where the price would reverse its trend. Draw S/R levels on your chart and keep your eyes on those levels closely
- The trading volume at breakout: The volume should be higher than normal at breakout, preferably from a news catalyst.
- Entry point: Buy at the new high of the day.
- Exit point: Sell quickly when flagpole (2) is losing its momentum.
- Stoploss: Set your stop loss just below the bottom of the consolidation phase.
- Position Sizing: Traders and investors use position size to estimate the quantity of securities (stocks) they may trade, which helps them manage risk and protect their accounts from large unplanned losses. We encourage avoiding risking more than 2% of your portfolio capital on any single trade as a rule of thumb.
- Risk profile: There are two types of traders: one is risk-taker and another one is risk-contrary. The risk-taker would buy during the consolidation whereas the risk-contrary would buy after the breakout.

As soon as, you spot a very high relative trading volume at the flagpole, wait for the consolidation phase. This consolidation or pullback should not retrace more than 50% of the flagpole.
During the consolidation, choose your position size, entry-exit, and stop-loss strategy. After this short pullback, if the stock moves towards the high of the day, implement your trading plan. For the above Bull flag, implement your strategy as marked in the figure below-
The psychology behind Bull Flag
Bull Flag resembles a flag on a pole that's why it is named Bull Flag. This pattern forms in a time of consolidation, which makes this a continuation pattern. This means that when the price breakout of the pattern, it's likely to continue in the same direction it was heading before.
Initially, you have several large candles that represent the flagpole abd is followed by a series of small candles moving sideways or a pullback, that creates a channel (support and resistance).
This sideway channel indicates the consolidation phase which means that the traders who bought stocks initially are now booking their profits. You may ask why the price did not decrease sharply? The answer is new buyers are still entering and sellers are not yet controlling the price.
While trading the Bull Flag pattern, it is important to notice that the pullback/ sideways phase should not retrace more than 50% of the flagpole.
FAQs on Bull Flag
There are primarily two best times to trade Bull Flag:
- After breakout
- Strong trending market
A Bear Flag pattern is exactly the same as the Bull Flag except the trend will be to the downside.
Yes, a Bull Flag pattern is a simple form of harmonic pattern. You can see it look like ABCD pattern but in a very short period of time.