Price Action Trading and Technical Analysis
Purpose: In trading, price action trading plays a crucial role in examining stock prices and other speculative assets. By studying price charts and identifying patterns, investors can make informed predictions about future price movements.
❖ What Is Technical Analysis?
- Technical analysis involves examining stock or asset price charts.
- Investors identify patterns and trends to predict future price movements.
- It’s widely used in financial markets alongside fundamental analysis.
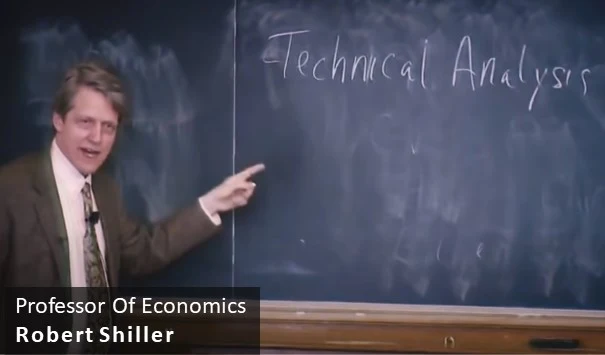
The process of technical analysis revolves around studying price charts and identifying patterns that provide insights into the movements of stock prices or other speculative asset prices. — ROBERT SHILLER
❖ Introduction to Price Action Trading
- Price Action Trading is a form of technical analysis that focuses on price movements without relying heavily on indicators.
- It is especially popular among:
- Swing traders
- Day traders
- Scalpers
- The primary objective is to understand what buyers and sellers are doing—and what they are likely to do next—based on price action.
Price action trading is a technique by which a trader reads the market and then interprets the market sentiments based on price movement on the chart, as opposed to by relying on lagging or leading technical indicators.
Is Price Action Trading the same as Technical Analysis?
Price Action Trading is a subset of technical analysis. While technical analysis often includes indicators and tools, price action focuses purely on reading price movements and patterns from the chart itself.
❖ Key Characteristics of Price Action Trading
- No reliance on lagging or leading indicators.
- Traders read and interpret the market using real-time price movements.
- Often called:
- Natural Trading
- Naked Trading
- Clean Chart Trading
- Raw Trading
❖ Clean Chart vs. Indicator-Heavy Chart
- Clean Chart (Naked Chart)
- Shows only price action with no indicators.
- Easier to read and analyze for many traders.
- Messy Chart (With Indicators)
- Includes multiple technical indicators.
- Can clutter the view and distract from raw price data.


Most price action traders prefer clean charts but may occasionally use a few indicators to support entry or exit decisions.
❖ Importance of Candlestick Analysis
- Before diving into price action, understanding candlestick patterns is essential.
- Candlestick patterns reveal:
- Market sentiment
- Momentum
- Potential reversals or continuations
❖ Psychology Behind Price Action
- Market movements follow cycles (what goes up often comes down).
- Price action trading helps traders:
- Identify trends early
- Make decisions based on behavior rather than rules
- Avoid over-reliance on rigid systems
❖ Why Traders Use Price Action
- Widely adopted by:
- Retail traders
- Hedge funds
- Institutional traders
- Applicable to all markets:
- Stocks
- Forex
- Futures
- Options
- Commodities
❖ Common Price Action Strategies
Traders often use these strategies to make informed decisions:- Inside Bar Pattern – A smaller bar within the high-low range of the previous bar
- Fakey Pattern – A false breakout followed by a strong reversal
- Pin Bar Pattern – Indicates a potential reversal due to strong rejection of price
- Breakouts – Trading based on price breaking past a key level
- Support and Resistance – Buying at support, selling at resistance
- Round Number Effect – Psychological price levels (e.g., 100, 1,000) acting as strong levels
❖ Price Action Tools
To support decision-making, traders rely on the following tools:- Candlesticks
- Volume analysis
- Trend lines
- Breakouts and pullbacks
- Human behavioral patterns
- Round numbers
- False highs and lows
- Support and resistance zones
Avoid blindly following setups like the Head and Shoulders or Bull Flag Pattern. Always analyze context before acting.
❖ How to Master Price Action Trading
- Consistently study clean charts.
- Challenge your assumptions.
- Ask critical questions with every setup.
- Use visual examples to reinforce concepts.
- Practice and learn from market behavior—not just from theory.
❖ Final Thoughts
- Price Action Trading is a powerful and flexible approach to market analysis.
- It strips away distractions and focuses on what the market is actually doing.
- With practice, it allows traders to make decisions confidently and independently.
Frequently Asked Questions PRICE ACTION TRADING
Do I need technical indicators for Price Action Trading?
Not necessarily. Price Action Trading emphasizes trading on a clean chart with minimal or no indicators. Some traders use indicators occasionally to support their entries or exits, but they are not essential.
Why is Price Action called 'naked' or 'clean chart' trading?
Because it involves analyzing raw price movements without cluttering the chart with multiple indicators. The focus is solely on how price behaves.
Is it necessary to learn candlestick patterns for Price Action Trading?
Yes. Candlestick patterns are fundamental to understanding price behavior. Familiarity with common patterns like pin bars, inside bars, and fakey setups greatly enhances your price action skills.
Can Price Action strategies be used in all markets?
Absolutely. Price Action strategies are universal and work in various markets like stocks, forex, commodities, futures, and options.
Is Price Action Trading suitable for beginners?
Yes, but it requires practice and patience. While the concept is simple, mastering it takes time, chart study, and experience in recognizing patterns and behavior.
Why do some people compare technical analysis to astrology?
Some critics believe technical patterns have no scientific basis. However, many successful traders argue that price reflects human psychology, which tends to follow repeatable patterns — making it a practical and proven approach when used correctly.
What are some common Price Action strategies I can start with?
You can start with:
- Pin Bar pattern
- Inside Bar pattern
- Fakey pattern
- Breakouts
- Support and Resistance
- Round number effect
Are indicators completely useless in Price Action Trading?
No, indicators aren’t useless — they’re just not the focus. Some price action traders use indicators like volume or moving averages as secondary tools to confirm their decisions.
How can I get better at Price Action Trading?
- Study clean charts regularly
- Practice identifying patterns
- Understand the psychology behind price moves
- Use visual examples
- Reflect and question every trade setup
Disclaimer: This analysis is provided solely for educational purposes and does not include any recommendations. For any financial decisions, it’s advised to consult with your financial advisor.