Introduction to Hanging Man

In this module, we are going to discuss the Hanging Man candle, which gives a very strong signal of a trend reversal (probably to downtrend). We'll show you what this looks like, its characteristics, and valid conditions for this candle.
In addition, we'll look at the psychology behind the Hanging Man candle and discuss predictions for the future.
The first thing we want to discuss with you is what a Hanging Man candle is.
Most traders believe that in order for a candle to be a genuine hanging man, the bottom wick must be two times the size of the body section of the candle, and the body must be at the higher end of the trading range.
Hanging Man Anatomy
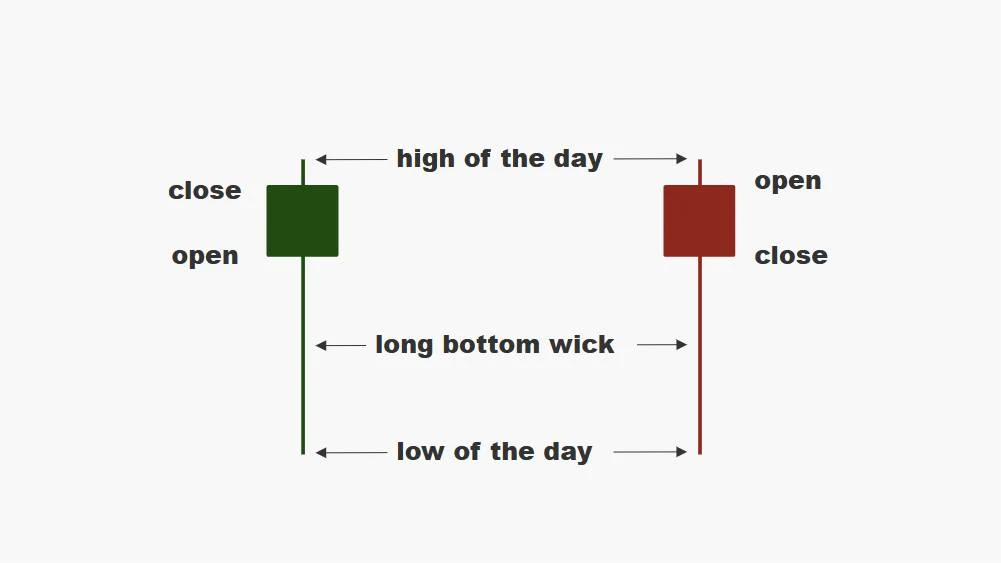
Characteristics of a Hanging Man candle
| Feature | Character |
|---|---|
| Formation | The pattern is made of a single candle. |
| Color | The Hanging Man candle can be green or red. |
| Real Body Position | The real body is at the top end of the candle's range. |
| Shadow | There is a long lower shadow. |
| Shadow Proportion | The lower shadow should be at least twice the height of the real body. |
| Range | The range shows some price movement but is smaller than the long shadow. |
| Volatility | Volatility can be present, showing that prices changed a lot during the session. |
| Trend | The Hanging Man usually appears at the end of an uptrend, suggesting a possible price drop. |
| Momentum | It indicates that buyers are losing strength, and sellers might take control. |
| Symmetry | The candle is not symmetrical, with a small body and a long lower shadow. |
| Volume | Higher volume can confirm the signal, but it’s not always necessary. |
Characteristics of a Hanging Man
- Hanging Man candle can be green or red.
- Small real body (at least two times smaller than wick/tail).
- Range of the candle is large. A large range shows huge volatility during the session.
- Hanging Man appears as a long candle.
- The body is fully located at the top of the range of the candlestick.
- Lower shadow/wick at least twice longer than the real body.
- Opening or closing the gap indicates a strong signal.
- Always appears in an uptrend.
- Red real body is more preferable.
- The longer the lower shadow, the better it will be. The fundamental of the Hanging Man candle is to monitor the momentum and price action.
Insight
Hanging Man candle gives a strong sign for a trend reversal to downtrend. The Hanging Man is not considered as bearish as the shooting star.
Have a look at 4 hr. price chart of JYPUSD pair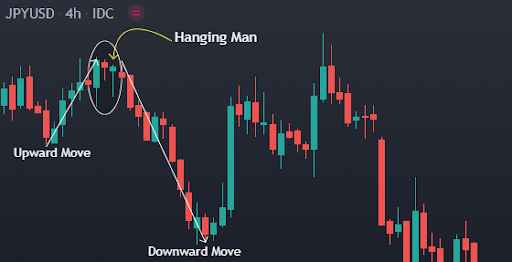
The price chart above is a 4 hr. chart of JYPUSD pair. Each candle represent the trading activity during the 4 hr. session. In the above figure, you can see during the upward move two consecutive hanging man candle forms which means there is a possibility of trend reversal. As expected, upward move is done and next few candles moves downwards.
Psychology of Hanging Man
You can spot the Hanging Man candle during an uptrend. In a trending market, you can find it as an opening or closing gap which indicates a strong signal. The long lower shadow indicates that the bears are controlling the market during the session.
When a Hanging Man candlestick forms in an uptrend, it shows a loss of buyer's strength. The hanging man candle indicates that there is high demand during the session and significant selling as well.
A question may strike your mind that if the demand is high then why buyers can't push the price up? The answer is all this is happening during an uptrend and the peak is near and significant selling is also there. Hence it is wise to stay out of from long position.
Limitations of the Hanging Man Candle
- False Signal: In strong uptrends, the Hanging Man can produce false signals, leading to incorrect trade entries.
- Dependence on Confirmation: This candle pattern requires confirmation from subsequent candles or additional indicators for reliable signals.
- Movement: The Hanging Man primarily indicates potential short-term reversals and may not reflect long-term price trends.
- Market View: The effectiveness of the Hanging Man is influenced by the overall market structure and context.
- Limited Use in Strong Trends: Less reliable in strong bullish trends where reversal patterns are less likely to succeed.
- Asset Variation: Success rates can vary significantly across different financial instruments.
- Point of View: Different traders may interpret the Hanging Man candle differently, leading to varying strategies.
- Volume Factor: Low trading volume can weaken the validity of the pattern, making volume analysis essential.
FAQs on Hanging Man
There are primarily two best times to trade Hanging Man:
1. When stock/ securities losing its trading momentum
2. Avoid trending market
In shape, Hanging Man & Hammer both look identical, but when it appears during an uptrend , called Hanging Man and when it appears during an downtrend, called as Hammer.
The 'Hanging Man' candle can either green or red. Both color indicates bearish reversal, color doesn't matter at all.
The Hanging Man can appear in any market, but because of the depth and volume in forex, the Hanging Man will appear frequently in forex.


