Introduction to Bearish Harami candle

In this module, we are going to discuss the Bearish Harami candle, which gives a very strong signal of a trend reversal (probably to downtrend). We'll show you what this looks like, its characteristics, and valid conditions for this candle.
In addition, we'll look at the psychology behind the Bearish Harami candle and discuss predictions for the future.
The first thing we want to discuss with you is what a Bearish Harami candle is.
During an uptrend, a small red candle that is completely contained within the body of the previous large green candle is called a bearish harami candle.
How to identify a bearish harami candle?
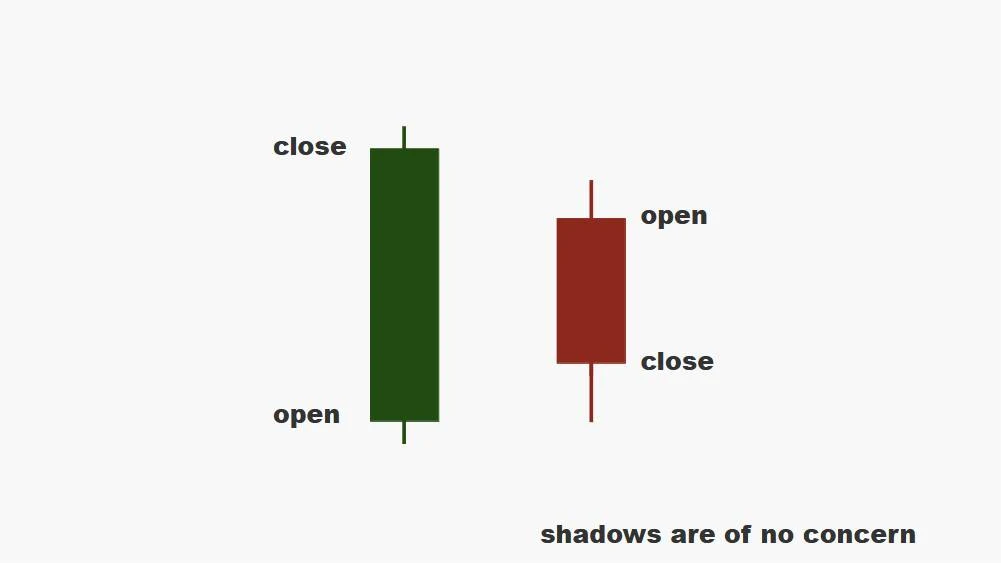
Characteristics of a Bearish Harami candle
| Feature | Character |
|---|---|
| Formation | The pattern consists of two candles. |
| Color | The first candle is green (bullish), and the second candle is red (bearish). |
| Real Body Position | The second candle's real body is smaller and fits inside the first candle's real body. |
| Shadow | Both candles may have shadows, but they are not very important. |
| Shadow Proportion | The second candle’s body is much smaller than the first, so shadows are less noticeable. |
| Range | The second candle’s range is inside the first candle’s range. |
| Volatility | Volatility is low in the second candle, showing indecision in the market. |
| Trend | Appears in an uptrend, signaling a possible bearish reversal. |
| Momentum | Momentum weakens, with buying slowing and selling possibly increasing. |
| Symmetry | The second candle is much smaller than the first, showing an asymmetrical structure. |
| Volume | Lower volume on the second candle often confirms the hesitation in the market. |
Blueprint of a Bearish Harami Candle on chart
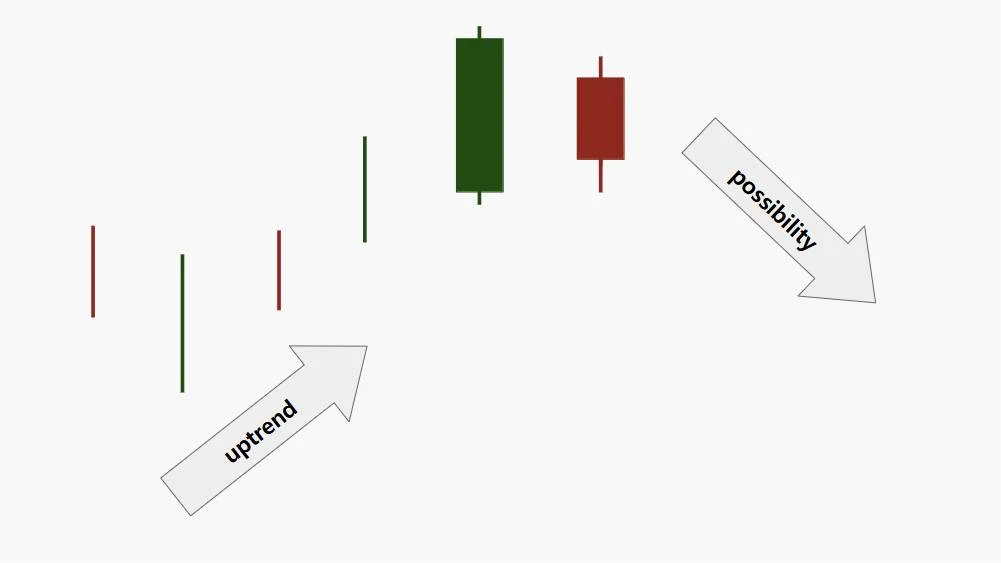
A Bearish Harami candle occurs during an uptrend and indicates the possibility of a counter-trend, meaning a reversal to a downtrend.
Limitations of the Bearish Harami Candle
- False Signal: In volatile markets, the Bearish Harami may give misleading signals, leading to incorrect trade entries.
- Dependence on Confirmation: Additional indicators or price action are needed to confirm the Bearish Harami’s reliability.
- Movement: This pattern usually indicates short-term bearish reversals, not necessarily signaling long-term trends.
- Market View: Its effectiveness can be affected by the overall market context and trend direction.
- Limited Use in Strong Trends: Less reliable in strongly trending markets where reversals are less likely.
- Asset Variation: Success rates can vary across different financial instruments and market conditions.
- Point of View: Traders may interpret the Bearish Harami differently, depending on their analysis style.
- Volume Factor: Low trading volume may reduce the validity of the Bearish Harami, making it less effective.
Next In Line


