Discovering the Doji: A Must-Know candle for Traders

In this module, we are going to discuss the Doji candle, which gives the information that there is no decision which way the market will go. We'll show you what this looks like, its characteristics, and valid conditions for this candle.
In addition, we'll look at the psychology behind the Doji candle and discuss predictions for the future.
The first thing we want to discuss with you is what a Doji candle is.
What are doji candles and how to use them in trading?
A Doji shows a balance of supply and demand, implying that neither the bulls nor the bears are prevailing in the market. Doji is a very powerful reversal candle as it creates market indecision between the bears and the bulls.
Doji Anatomy

Characteristics of a Doji candle
| Feature | Character |
|---|---|
| Formation | The pattern is made up of one candle. |
| Color | The candle can be green or red, but the color is not important. |
| Real Body Position | The real body is very small and is near the middle of the candle. |
| Shadow | There are long shadows both above and below the real body. |
| Shadow Proportion | The shadows can be much longer than the real body. |
| Range | The range shows that the price moved up and down a lot during the session. |
| Volatility | Volatility is low, as the price closed near the opening price despite the significant range. |
| Trend | The Doji can appear in any trend, but it often signals indecision in the market. |
| Momentum | Momentum is unclear, as buyers and sellers are about equal. |
| Symmetry | The candle is usually symmetrical because the shadows are similar in length. |
| Volume | Volume can be low, indicating less interest from traders. |
Psychology About Doji
Doji is considered as most popular reversal candle and it is easy to identify as you can see in the above figure.
In the case of an uptrend, the bulls have won previous battles during the session as prices have moved higher. Now if you encountered a Doji at the top of the uptrend, it indicates the indecision in the market and there is a possibility of a trend reversal.
The same can be said for a Doji that appears in a downtrend market, indicating that the bears may be struggling to dominate the market, and thus a reversal uptrend may be occurring.
We can say clearly—
- Doji's are easy to identify.
- Doji's can give an idea of financial market direction.
- Doji indicates a lack of volatility.
- Doji provides a limited view.
Limitations of the Doji Candlestick
- False Signal: In volatile markets, a Doji can lead to misleading signals, causing traders to make incorrect entries.
- Dependence on Confirmation: A Doji often requires additional confirmation from subsequent candles or indicators for a reliable trading decision.
- Movement: The Doji primarily indicates indecision in the market and may not predict clear short-term or long-term trends.
- Market View: The effectiveness of a Doji candle is highly dependent on the broader market context and prevailing trends.
- Limited Use in Strong Trends: Less reliable in strong bullish or bearish trends, where market momentum may overshadow the Doji's signal.
- Asset Variation: Success rates can differ depending on the financial instrument being analyzed.
- Point of View: Traders may interpret Doji candles differently, leading to varied strategies and outcomes.
- Volume Factor: Low trading volume can diminish the validity of the Doji pattern, making it essential to consider volume alongside the signal.
Types of Doji
There are mainly 5 types of Doji candles that are commonly traded and popular in the financial market—- Standard Doji
- Long-Legged Doji
- Gravestone Doji
- Dragon-fly Doji
- 4- price Doji
1. Standard Doji

Characteristics of a Standard Doji Candle
| Feature | Character |
|---|---|
| Formation | The pattern is made up of one candle. |
| Color | The candle can be green or red, but the color is not important. |
| Real Body Position | The real body is very small and is near the middle of the candle. |
| Shadow | There are long shadows both above and below the real body. |
| Shadow Proportion | The shadows can be much longer than the real body. |
| Range | The range shows that the price moved significantly during the session. |
| Volatility | Low volatility is present, as the price closed near the opening price despite the significant range. |
| Trend | The Standard Doji can appear in any trend, but it often signals indecision in the market. |
| Momentum | Momentum is unclear, as buyers and sellers are about equal. |
| Symmetry | The candle is usually symmetrical because the shadows are similar in length. |
| Volume | Volume can be low, indicating less interest from traders. |
Insight of Standard Doji
Neither bullish nor bearish.
Psychology of Standard Doji
- Indicates neither bulls nor bears have a monopoly on the market.
- It doesn't signify much on its own in comparison with other types of Dojis.
- To understand standard Doji candles, traders must observe the prior price action.
- Try not to trade alone this type of candle (wait for confirmation before entering the trade).
2. Long-Legged Doji
As you can see in the figure A Long-Legged Doji is a long Candlestick pattern.
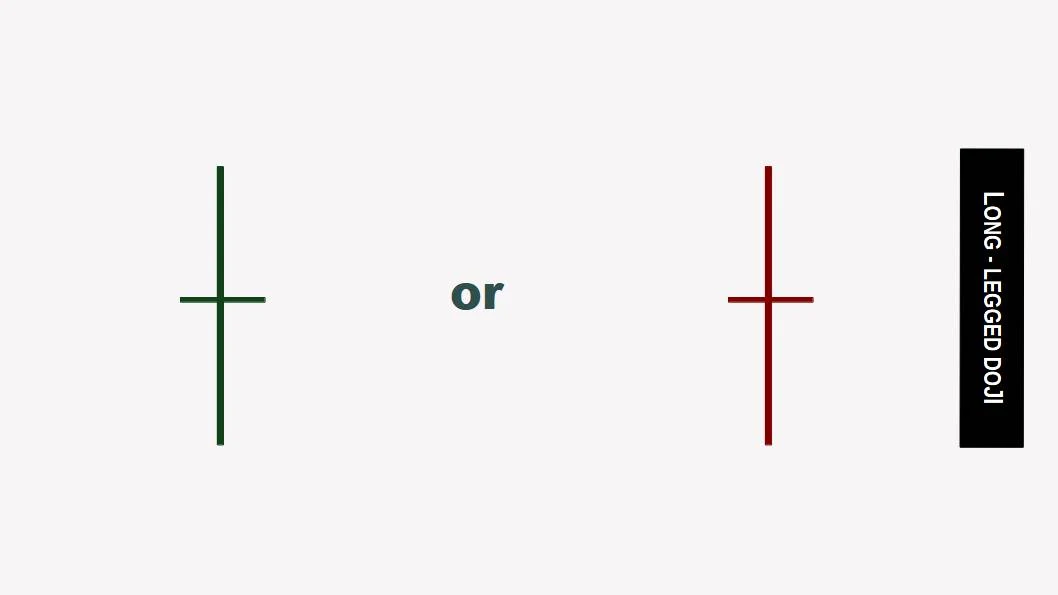
Characteristics of a Long-Legged Doji Candle
| Feature | Character |
|---|---|
| Formation | The pattern is made up of one candle. |
| Color | The candle can be green or red, but the color is not important. |
| Real Body Position | The real body is very small and is near the middle of the candle. |
| Shadow | There are long shadows both above and below the real body. |
| Shadow Proportion | The shadows are significantly longer than the real body, indicating indecision. |
| Range | The range shows that the price moved significantly in both directions during the session. |
| Volatility | Low volatility is present, as the price closed near the opening price despite the large range. |
| Trend | The Long-Legged Doji can appear in any trend, often signaling indecision in the market. |
| Momentum | Momentum is unclear, as buyers and sellers are about equal. |
| Symmetry | The candle is usually symmetrical with long shadows of similar length. |
| Volume | Volume can be low, indicating less interest from traders. |
Insight of Long-Legged Doji
There may be a chance that securities prices will increase following the appearance of the Long-Legged Doji candle.
Psychology of Long-Legged Doji
- The prior trend and the Doji pattern determine the trend's future direction.
- Alone this signal is not strong, wait for other conditions to be confirmed before entering the trade.
- Long-Legged Doji indicates that during the session of the candle price action dramatically moved up and down.
- Indicates indecision between buyers and sellers with high volatility.
- Provide limited view.
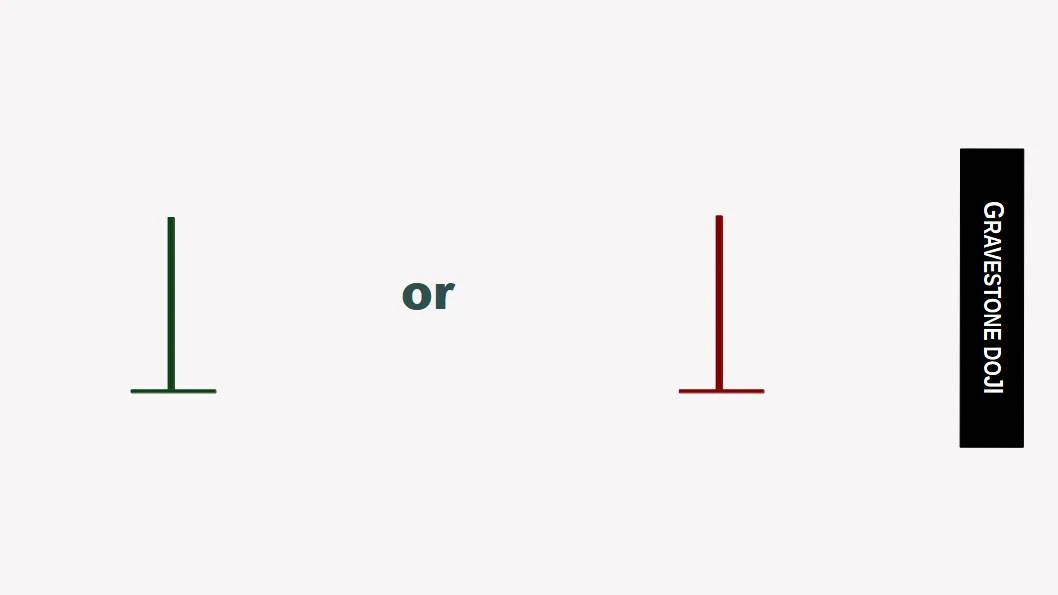
3. Gravestone Doji
As you can see in figure A Gravestone Doji is formed.
Characteristics of a Gravestone Doji Candle
| Feature | Character |
|---|---|
| Formation | The pattern is made up of one candle. |
| Color | The candle is typically red, but it can also be green. |
| Real Body Position | The real body is very small and is located at the bottom of the candle. |
| Shadow | There is a long upper shadow and little to no lower shadow. |
| Shadow Proportion | The upper shadow is much longer than the real body, indicating selling pressure. |
| Range | The range shows that the price moved significantly upward during the session. |
| Volatility | Low volatility is present, as the price closed near the opening price despite the large range. |
| Trend | The Gravestone Doji typically appears at the end of an uptrend, signaling a potential reversal. |
| Momentum | Momentum shifts from buying to selling, indicating potential bearish reversal. |
| Symmetry | The candle is usually asymmetrical, with a very small real body and a long upper shadow. |
| Volume | Volume can be high, supporting the reversal signal. |
Insight of Gravestone Doji
A Gravestone Doji is a bearish pattern that indicates reversal followed by a downtrend in the price action.
Similar to its upright twin brother, it possibly signifies a reversal of the current trend.
Psychology of Gravestone Doji
- The buyers dominate early on, but all of a sudden sellers came and dominate the market.
- Gravestone Doji candle gives the signal that there is a possibility of a trend reversal.
- Generally indicates that bearish movement might be start followed by a downtrend.
- Indicates indecision between buyers and sellers with high volatility.
- Alone it provides a limited view.
- Wait for confirmation before entering the trade as the signal is not strong.
- Gravestone Doji is more bearish and thus more effective at a market top.
4. Dragonfly Doji
As you can see in the figure A DRAGONFLY Doji is formed.

Characteristics of a Dragonfly Doji Candle
| Feature | Character |
|---|---|
| Formation | The pattern is made up of one candle. |
| Color | The candle can be green or red, but the color is often less significant. |
| Real Body Position | The real body is very small and is located at the top of the candle. |
| Shadow | There is a long lower shadow and little to no upper shadow. |
| Shadow Proportion | The lower shadow is much longer than the real body, indicating buying pressure. |
| Range | The range shows that the price moved significantly downward during the session. |
| Volatility | Low volatility is present, as the price closed near the opening price despite the large range. |
| Trend | The Dragonfly Doji typically appears at the end of a downtrend, signaling a potential reversal. |
| Momentum | Momentum shifts from selling to buying, indicating potential bullish reversal. |
| Symmetry | The candle is usually asymmetrical, with a very small real body and a long lower shadow. |
| Volume | Volume can be high, supporting the reversal signal. |
Insight of Dragonfly Doji
A Dragonfly Doji can appear either at the top of an uptrend or the bottom of a downtrend and indicates the potential for a change in direction.
Psychology About Dragonfly Doji
- The sellers dominate early on, but all of a sudden buyers came and overtake the market.
- Dragonfly Doji is usually found at the bottom reversal.
- Dragonfly is more bullish, and thus more effective at a market bottom.
- Indicates the possibility of a trend reversal.
- Alone it provides a limited view.
- Wait for confirmation before entering the trade as the signal is not strong.
- Dragonfly candle forms a strong reversal pattern in the down-trending market.
5. 4-Price Doji
As you can see in the figure a 4-price Doji is formed.
Generally formed in the pre-market session.

Characteristics of a 4-Price Doji Candle
| Feature | Character |
|---|---|
| Formation | The pattern is made up of one candle. |
| Color | The candle can be green or red, but the color is not significant. |
| Real Body Position | The real body is extremely small and centered between the high and low prices. |
| Shadow | There are no shadows; the high and low prices are the same as the opening and closing prices. |
| Shadow Proportion | There are no shadows to consider, making it perfectly symmetrical. |
| Range | The range shows no movement; the price opens, closes, and trades at the same level. |
| Volatility | Very low volatility is present, indicating a lack of price movement. |
| Trend | The 4-Price Doji can appear in any trend and indicates strong indecision in the market. |
| Momentum | Momentum is neutral, as buyers and sellers are completely balanced. |
| Symmetry | The candle is perfectly symmetrical due to the absence of shadows. |
| Volume | Volume can be low, suggesting a lack of interest from traders. |
Insight of 4-Price Doji
This form of Doji indicates the ultimate in indecision. It is a unique pattern signifying an extremely quiet market.
Psychology About 4-Price Doji
- Neither sellers nor buyers were dominating the market during the session.
- 4-price Doji usually can be seen during the pre-market and after trading hours.
- It is typically suggested to avoid the stock or assets that are creating the 4-price Doji because they will cause a shortage of liquidity in the future.
- Trading 4-price Doji needs strict discipline and emotion-free trading.
- Wait for confirmation before entering the trade as the signal is not strong
- Use of proper stop-loss, profit level, and capital management is advised.