ABCD Pattern Strategy: Technical Analysis

Patterns are a key component of trading, and traders rely on them while making small and big trades. The ABCD pattern consists of three components: time, price, and structure. It's a great pattern to start with whether you're a beginning or intermediate trader because it's the foundation for all other patterns.
The ABCD pattern is easy to spot in various markets, in any market condition, and on any timeframe. But as a day trader, 5 minute or 15 minutes timeframe chart is more considerable.
ABCD pattern has a self-fulfilling prophecy effect. You should do what everyone is doing since a trend is your buddy.
Before we dive into the ABCD pattern strategy one thing we want to clear is that the strategy we're going to discuss is completely different from the traditional harmonic ABCD pattern where you see Fibonacci levels and all. At this point, we are going to explain a more simplified version of the ABCD pattern that actually works in the market.
Let's catch a glimpse of the ABCD pattern

Don't worry, there will be enough of complete charts later in this lesson when we explore how to use what is shown in real-world trading.
ABCD Pattern Trading Rules
- Draw S/R
- Check the trading volume from A to B
- Entry point
- Exit point
- Stoploss
- Position Sizing
- Your risk profile
- S/R : Support and Resistance (S/R) are the points where the price would reverse its trend. Draw S/R levels on your chart and keep your eyes on those levels closely.
- The trading volume from A to B : The volume of security from A to B should be higher than normal
- Entry point : Buy between C and D.
- Exit point :Sell your first half position after point D and sell your second half position after reversal as shown in the above figure.
- Stoploss : Set your stoploss just below point C.
- Position Sizing : Traders and investors use position size to estimate the quantity of securities (stocks) they may trade, which helps them manage risk and protect their accounts from large unplanned losses. We encourage avoiding risking more than 2% of your portfolio capital on any single trade as a rule of thumb.
- Risk profile : There are two types of traders : one is risk-taker and another one is risk-contrary. The risk-taker would buy the stock between C and D point whereas the risk-contrary would buy after point D which is the high of the day.

Let's take a look at Apple on 2nd Nov '21, the stock surged up from (A) to (B). Many retail traders have waited for point C which is a support zone ( buyers wouldn't let the price go down). Now, it's your time to take a buy call and set your stop loss below point (C). Your exit should be when the stock signals weakness as shown in the above figure ( weakness means you spot any reversal candlestick during an uptrend ).
ABCD Pattern [Step By Step]
ABCD pattern starts with a strong upward move because buyers are aggressively buying. There must be some catalyst (event/news) behind this buying. As a result, stock from point A extends to point B making new highs of the day.
At point B, you should be proactive and not chase the trade because at point B it may be too late to enter ( you catch the news late ). Moreover, you cannot say where your stop-loss should be.
At point B, there is a pullback as some traders start selling it for profit and prices come down. As an extra caution, you should wait during the pullback because you don't know the bottom of this pullback. After a few bars/candles, the stock will find a potential support i.e point C.
Now at point C, some new traders will enter and bring the price to the new highs of the day (point D). After point C, you can start your game.
Look at another example of Starbucks stock (SBUX)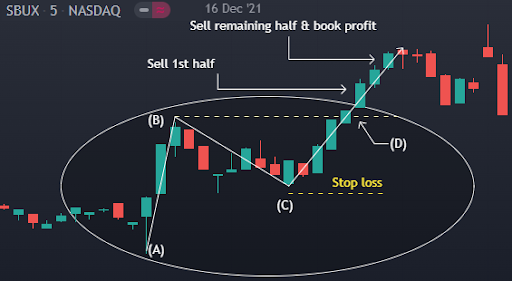
Let's look at one more example of Starbucks Corporation on 16th Dec '21. The trading process is the same as discussed above but you may ask what if the price didn't reverse after selling all shares? You may miss a great opportunity. To avoid this kind of situation you can use the trailing stop loss strategy after point (D).
The Trade Trap
A trader should not trade when the volume at point B and point D is low as it indicates that other traders are losing their interest in the stock.
You should also avoid trading during the pullback (B to C) because you don't know the bottom of this pullback.
Summary— ABCD Trading
- When you spot a stock surging up from point A to point B(new high). Don't jump into the trade right away. Wait to see if there is support (i.e point C) higher than point A.
- Pay attention during the consolidation period (B to C).
- Be ready with your checklist such as S/R, entry-exit, position size, and stop during the sideways market.
- Enter at point C. Set stop-loss below point C, if the price goes below C then sell and accept the loss gently (don’t seek revenge).
- Book profit after point D. Here you can set trailing stop-loss.
Frequently Asked Questions ABCD PATTERN
ABCD pattern is valid if —
- Volume at B and D should be high.
- Point C should not retrace more than point A. Many risk contrary traders don't trade if this retracement from B to C is more than 50% of AB.
- Consolidation at C is for a short time duration (few candles only).
Yes, ABCD is considered as the simplest form of harmonic pattern.
- ABC Bullish/Bearish
- AB=CD Bullish/Bearish
- Butterfly Bullish/Bearish
- Crab Bullish/Bearish
- Gartley Bullish/Bearish
- Shark Bullish/Bearish
- Cypher Bullish/Bearish
- Bat Bullish/Bearish
- 3-Drives Bullish/Bearish
- Flag Bullish/Bearish
Disclaimer: This analysis is provided solely for educational purposes and does not include any recommendations. For any financial decisions, it’s advised to consult with your financial advisor.