SWING TRADING: How To Trade Marubozu Candle
Marubozu is a single candlestick pattern that is formed by just one candle. We have explained all the basics of Marubozu in the Candlesticks section. Go through the basics to get the most out of this article (experience traders can skip this).
We're assuming that you were aware of the basics of Marubozu. Now coming back to our main discussion How to trade Marubozu?
Having decided to buy the stock, the first thing you should do is to prepare the checklist of your trading strategy (doesn't matter on which pattern or plan you're working on, put your plan on paper).
Trading Checklist
- Draw S/R
- Check the length of the Marubozu Candle
- Entry-Exit point
- Stoploss
- Position Sizing
- Your risk profile
- S/R : Support and Resistance (S/R) are the points where the price would reverse its trend. Draw S/R levels on your chart and keep your eyes on those levels closely.
- Length of the candle : One needs to keep their eyes on the length of the candle. The long candle signifies that there is an intense buying or selling activity whereas the short candle signifies that traders/investors are losing their interest in buying or selling.
You should avoid very short candles or very large candles( as we discussed in the basics of Marubozu), look for long candles with reasonable volume. - Entry-Exit point : We'll discuss the Entry-Exit point through an example later in this article for better understanding.
- Stoploss : Single candlestick pattern can be extremely profitable but it can also be very risky if not executed correctly. Hence it is very important to put your stoploss in the system. Later in this article, we'll explain where to set your stoploss through an example.
- Position Sizing : Position sizing is a technique used by traders/investors to determine the number of securities (stocks) they can trade, that helps them to control risk and secure their account from huge uncalculated loss. As a thumb rule, we recommend you not to risk more than 2% of your portfolio capital on any one trade.
- Risk profile : There are two types of traders : one is risk-taker and another one is risk-contrary. The risk-taker would buy the stock on the same day as the Marubozu is being formed whereas the risk-contrary would buy the day after the pattern has been formed i.e next day.

Trading with Bullish Marubozu
Bullish Marubozu indicates that the buyers are dominating the market and bullishness may continue over the next few trading session. Hence a trader should look for buying opportunities.
Entry point should be around the closing price of the Bullish Marubozu.
Stoploss should be around the opening price of the Bullish Marubozu.
Exit Point depends on your risk profile and it can vary from trader to trader based on their temperament.
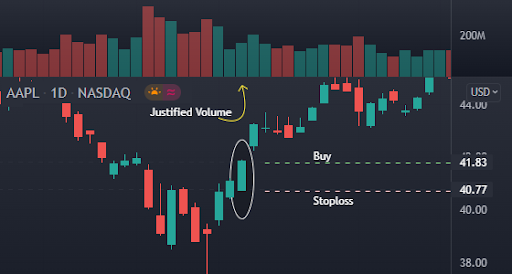
The encircled candle is a Bullish Marubozu.
OHLC DATA :
Open(O) - 40.60
High(H) - 41.90
Low(L) - 40.77
Close(C) - 41.85
Buy price should be arround - $41.80
Stoploss should be around - $40.70
Exit Point - Candlestick patterns do not give us an approaching target. In that case, we suggest you to follow the "1:2 R/R ratio" rule to book the profit. According to the 1:2 Risk/Reward ratio if you risk 2000 bucks then the expected reward should be 4000 bucks. Treat Marubozu as a short-term trade and you need to be quick in booking profits.
In the above chart, you can take an exit position @ $45.00, which is more than the 1:2 R/R ratio. But if you want to wait for few more days then put trailing stoploss.
Trading with Bearish Marubozu
Bearish Marubozu indicates that the sellers are dominating the market and bearishness may continue over the next few trading session. Hence a trader should look for selling opportunities.
Entry point should be around the closing price of the Bearish Marubozu.
Stoploss should be around the opening price of the Bearish Marubozu.
Exit Point depends on your risk profile and it can vary from trader to trader based on their temperament.
Again take an example of the same company [ Ticker : AAPL ]

The encircled candle is a Bearish Marubozu.
OHLC DATA :
Open(O) - 148.86
High(H) - 148.86
Low(L) - 145.96
Close(C) - 145.96
Sell price should be arround - $146.0
Stoploss should be around - $149.10
Exit Point - Candlestick patterns do not give us an approaching target. In that case, we suggest you follow the "1:2 R/R ratio" rule to book the profit. According to the 1:2 Risk/Reward ratio if you risk 500 bucks then the expected reward should be 1000 bucks. Treat Marubozu as a short-term trade and you need to be quick in booking profits.
In the above chart, you can take exit position @ $122.30, which is a 1:2 R/R ratio.
Validating risk profile
As we discussed that there are two types of traders one is a "Risk-taker" and another one is "Risk-Contrary".The risk-taker would buy the stock on the same day as the Marubozu is being formed whereas the risk-contrary would buy the day after the pattern has been formed i.e next day. But before taking a position(buy or sell), the trader needs to validate the formation of Marubozu.
In any market 10 minutes before the closing market, you need to check out Is there any Marubozu is forming? If there is a Marubozu (Bearish or Bullish).
"Risk-taker" can wait and buy the stock around the closing point whereas "Risk-contrary" can buy the stock on the next day. however, before buying the stock trader needs to follow the checklist mentioned above.
In the above two chart examples, both "Risk-taker" and "Risk-Contrary" are profitable. Now, let's discuss one more example with a different scenario.
The chart below depicts a Bearish Marubozu pattern that would not have worked out for the risk-taker but would have been avoided by a risk-contrary trader.


|
Top 10 Books For Day TradersLIBRARY |
The trade trap
A trader should avoid smaller or larger Marubozu candles. Why? The reason is smaller candle indicates that other traders are losing their interest in the stock and the problem with larger candle is the placement of stoploss. The stoploss is deep in the case of larger candles and the penalty would be high if the trade goes wrong.
Now you may ask what are the criteria for a smaller or larger candle? We suggest you not trade a minimal (below 1% range) or larger candle (above 10% range).