How To Draw Trendline?
Case: 1 Downward Trendline
In a Downtrend In an Downtrend, the price makes lower lows and lower highs. , trend lines should be drawn above the price and this downward trendline always act as resistance.![Trendline Higher Highs & Parallel line](https://blogger.googleusercontent.com/img/b/R29vZ2xl/AVvXsEh0IKC08BaE2P4ZKc46LORCHR-lSqfNJcIG6r1DKU6LIxoLmy_4fmEk73nNsB3_ioFMG-ZTzBTBi_rce8pNB5nxVGY9r_RyiybMh50PsI7lTmB20vgXTuT5CQHRsB-P2BXsLImTdzhEMvQha35Gyr3k7vXowPBVcm5QvtVqbw_yOXlXPI1kJv_krA/s1600-rw/downtrend-trendline.jpg)
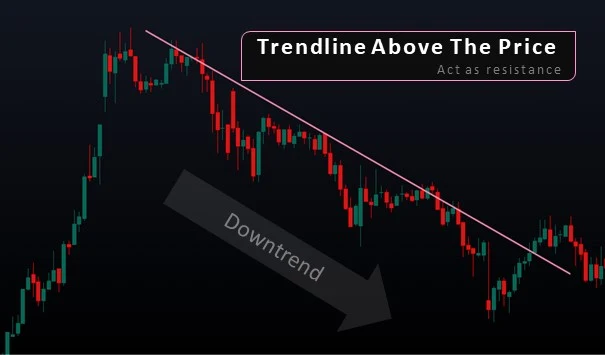
Case: 2 Upward Trendline
In an Uptrend In an Uptrend, the price makes higher highs and higher lows. , trend lines should be drawn below the price and this upward trendline always act as support.![Trendline Higher Highs & Parallel line](https://blogger.googleusercontent.com/img/b/R29vZ2xl/AVvXsEg5N9OhVFcomYGBtFLOVYfFWzUwt4WVaoNYfgcC3fxiaCo7Q5jqXUepUaEQQmG__sdSfFCvbUIQzIX-smjosJw7VMrlYJgYwA9W3Zb-6MoFB1KJKdIpbUQrmKeWYWD_VGYIqxc6u-_-3yF25FkHulx-N1Hktj4i4fPOBmOwz_IxfmvRAWA-SjSAGQ/s1600-rw/uptrend-trendline.jpg)
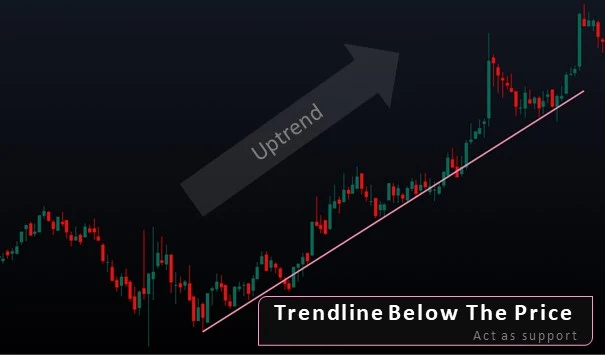
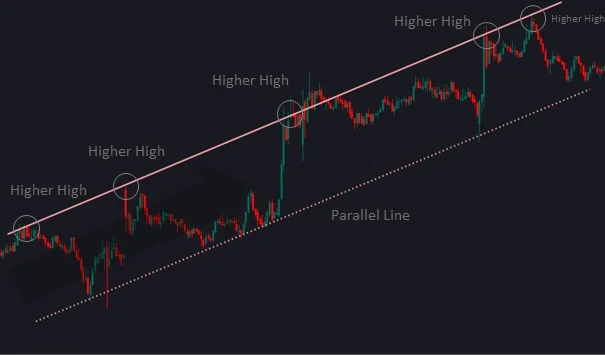
Case: 3 Trendline using Higher Highs & Parallel line
You can draw a trendline by connecting the Higher Highs in uptrend and taking the parallel off the subsequent Low, as shown in the figure. The parallel line shows support.
![Trendline Higher Highs & Parallel line](https://blogger.googleusercontent.com/img/b/R29vZ2xl/AVvXsEgPdT71JOYBWeOQn3xzBYj_oo_T1g6abjPsMj3pywmcKnLEXx7KgfVK4qQ1n0g6Ae-okS_ns8W-zugMq4H0qZiCKMzzQdg9zwJCZYzpeD4rulNXWbQ_gu4jg8pmPZ21H1YhsAfxyeH2q72H7rMuq5RjSNiAS9DI2GvwWtnQ3BUW7AwE38gNnx9hnw/s1600-rw/higher%20high%20trendline.jpg)
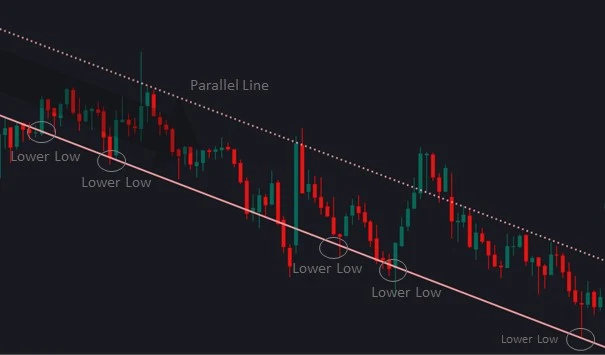
Case: 4 Trendline using Lower Lows & Parallel line
You can draw a trendline by connecting the Lower Lows in downtrend and taking the parallel off the subsequent High, as shown in the figure. The parallel line shows resistance.
![Trendline Lower Lows & Parallel line](https://blogger.googleusercontent.com/img/b/R29vZ2xl/AVvXsEijX49uWWIlllycWsDOmfL8hTTM9udhnCFhGFZgqxTmq9hE2av3XcfkL_6fzOKNg8-nBJdZqwlK3v9YjVCkmXUgA9_BvCACZ-5DMASR92kgodkRjCZgyAzFYuNBzYj503BUSvc1GdGhq1qG6hziIjP8Rkx2uF4JOkknsyZx3SReGa7-CfXRHBj1mQ/s1600-rw/lower%20low%20trendline.jpg)
Next In Line
![Doji Candlestick](https://blogger.googleusercontent.com/img/b/R29vZ2xl/AVvXsEjcnhw7Q8BytBgVXjVp75wrBtgMjXTnPnvd11UgKJtrLK8v5WWZ_tuas9q0_3jNMFNisHfidomX-zKJadRQLh4PWNJdJu_AVZ20FTq5ZPlY_Dn-4oig6OYPjtAVKPNEWRKZTDf9yhPkodel7iyAROdC42G0cb1DQjKftyWsCHXhzVpPrKAFOq5UdPhb/s1600-rw/Doji%20Candle.jpg)
Doji Candlestick
Doji is a very powerful candle shows a balance of supply and demand.
Read More![Hanging Man Candlestick](https://blogger.googleusercontent.com/img/b/R29vZ2xl/AVvXsEgvzgRa7VdK3_6ZZQo4YCs6RC-ktXjTQK5iJ7_ucMnJ-78OsNV7_048oUps-qdpcTuYI7Q1Az79ZJCKX7hCnz19Fjkx-3R_FV4MpyNavkoM6gj7AxlIgGNuESuJ8zlJfQrM2Rqn1jx25UHuVNGv4kUou9Xukr8wgWfELUY5mn4_np5kf32OKm6igA/s1600-rw/hanging%20man%20candlesticks.jpg)
Hanging Man Candlestick
Hanging Man candle which gives a very strong signal of a trend reversal.
Read MoreInverted Hammer Candlestick
This candle implies a very strong signal of a trend reversal (to uptrend).
Read More![Moving Average Indicator](https://blogger.googleusercontent.com/img/b/R29vZ2xl/AVvXsEhaVbvdJvvnQwHfyCfkho_H1vap39SpYyf7FNxpzFI4g7ABswfp3AUtwydKvRx9-GYbSYBd7M7lFqW8eSptcSI27W4b_iJG0RZfgbgzds2fADdjJJbzvtU5YwPQkyleVoF8BmCONNhq6hMl7EJaIk1TGa8UkKNa9JEKN1A7BoNCKQfPTYSD9BnN3g/s1600-rw/moving%20average%20indicator.jpg)
Moving Average Indicator
This indicator is used on charts for trend identification.
Read More ADVERTISEMENT
CONTINUE READING